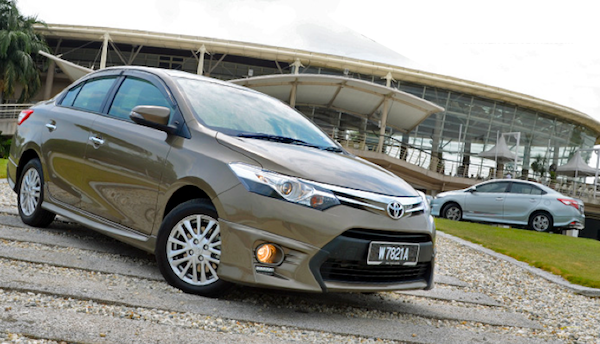
 The new Vios helped Toyota up to 16.8% share this month.
* See the Top 45 All-brands ranking by clicking on the title! *
The Malaysian new car market is up 2% year-on-year in March to 58,919 registrations, bringing the First Quarter total to 159,910 units, up just 1% on 2013. Perodua at 27.7% share and Proton at 20.9% are very close to their year-to-date levels (27.5% and 20.5% respectively), but Toyota shoots up to 16.8% share thanks to 9,886 sales in March vs. 15.1% so far in 2013. Boosted by strong sales of the all-new Vios, can Toyota threaten Proton for the 2nd spot overall later this year? The entire Top 8 brands are identical in March vs. year-to-date. Let’s also salute Kia back up 6 spots on February to #9 and Chevrolet up two to #8
Previous month: Malaysia February 2014: Now with Top 46 All-brands ranking!
One year ago: Malaysia March 2013: Market back up 8%
Full March 2014 Top 45 All-brands Ranking Table below.
Malaysia March 2014 – brands:
| Pos | Brand | Mar-14 | % | Feb | 2014 | % | Pos | FY13 |
| 1 | Perodua | 16,324 | 27.7% | 1 | 44,024 | 27.5% | 1 | 1 |
| 2 | Proton | 12,315 | 20.9% | 2 | 32,734 | 20.5% | 2 | 2 |
| 3 | Toyota | 9,886 | 16.8% | 3 | 24,185 | 15.1% | 3 | 3 |
| 4 | Honda | 4,915 | 8.3% | 4 | 15,627 | 9.8% | 4 | 5 |
| 5 | Nissan | 3,994 | 6.8% | 5 | 11,957 | 7.5% | 5 | 4 |
| 6 | Mitsubishi | 1,560 | 2.6% | 6 | 3,747 | 2.3% | 6 | 6 |
| 7 | Ford | 1,049 | 1.8% | 9 | 2,924 | 1.8% | 7 | 9 |
| 8 | Volkswagen | 977 | 1.7% | 8 | 2,704 | 1.7% | 8 | 10 |
| 9 | Kia | 972 | 1.6% | 15 | 2,392 | 1.5% | 11 | 12 |
| 10 | Isuzu | 939 | 1.6% | 10 | 2,447 | 1.5% | 10 | 8 |
| 11 | Mazda | 918 | 1.6% | 12 | 2,257 | 1.4% | 12 | 11 |
| 12 | Hyundai-Inokom | 917 | 1.6% | 7 | 2,696 | 1.7% | 9 | 7 |
| 13 | BMW | 668 | 1.1% | 14 | 1,735 | 1.1% | 13 | 13 |
| 14 | Mercedes | 642 | 1.1% | 13 | 1,707 | 1.1% | 14 | 16 |
| 15 | Hino | 529 | 0.9% | 16 | 1,425 | 0.9% | 17 | 14 |
| 16 | Suzuki | 420 | 0.7% | 17 | 1,550 | 1.0% | 16 | 17 |
| 17 | Peugeot | 400 | 0.7% | 11 | 1,581 | 1.0% | 15 | 15 |
| 18 | Chevrolet | 262 | 0.4% | 20 | 515 | 0.3% | 19 | 21 |
| 19 | Mitsubishi Fuso | 197 | 0.3% | 19 | 526 | 0.3% | 18 | 20 |
| 20 | Lexus | 160 | 0.3% | 18 | 449 | 0.3% | 21 | 22 |
| 21 | Subaru | 158 | 0.3% | 21 | 479 | 0.3% | 20 | 24 |
| 22 | Land Rover | 96 | 0.2% | 23 | 246 | 0.2% | 23 | 25 |
| 23 | Daihatsu | 71 | 0.1% | 25 | 227 | 0.1% | 24 | 23 |
| 24 | Volvo | 68 | 0.1% | 26 | 220 | 0.1% | 25 | 26 |
| 25 | Scania | 64 | 0.1% | 27 | 184 | 0.1% | 26 | 28 |
| 26 | Audi | 56 | 0.1% | 22 | 328 | 0.2% | 22 | 19 |
| 27 | Sinotruk | 54 | 0.1% | 30 | 118 | 0.1% | 29 | 29 |
| 28 | Mini | 53 | 0.1% | 28 | 132 | 0.1% | 28 | 30 |
| 29 | CAMC | 48 | 0.1% | 24 | 153 | 0.1% | 27 | 31 |
| 30 | JAC | 47 | 0.1% | 31 | 93 | 0.1% | 31 | 37 |
| 31 | Chery | 33 | 0.1% | 29 | 114 | 0.1% | 30 | 27 |
| 32 | SsangYong | 22 | 0.0% | 32 | 65 | 0.0% | 33 | 32 |
| 33 | Bison | 20 | 0.0% | 34 | 66 | 0.0% | 32 | 38 |
| 34 | Porsche | 18 | 0.0% | 36 | 64 | 0.0% | 34 | 34 |
| 35 | Chana | 16 | 0.0% | 33 | 62 | 0.0% | 35 | 36 |
| 36 | Great Wall | 11 | 0.0% | 37 | 30 | 0.0% | 36 | 33 |
| 37 | JBC | 7 | 0.0% | 40 | 21 | 0.0% | 39 | 39 |
| 38 | Renault Trucks | 7 | 0.0% | 42 | 12 | 0.0% | 42 | - |
| 39 | Auman | 5 | 0.0% | 35 | 27 | 0.0% | 37 | 40 |
| 40 | Man | 5 | 0.0% | 38 | 25 | 0.0% | 38 | 35 |
| 41 | Bei Ben | 4 | 0.0% | 41 | 16 | 0.0% | 41 | n/a |
| 42 | Naza | 4 | 0.0% | 45 | 9 | 0.0% | 43 | 18 |
| 43 | Renault | 4 | 0.0% | 46 | 7 | 0.0% | 45 | 41 |
| 44 | Yutong | 3 | 0.0% | 39 | 18 | 0.0% | 40 | 45 |
| 45 | BAW | 1 | 0.0% | 43 | 7 | 0.0% | 44 | 42 |
Source: MAA, Motor Trader


