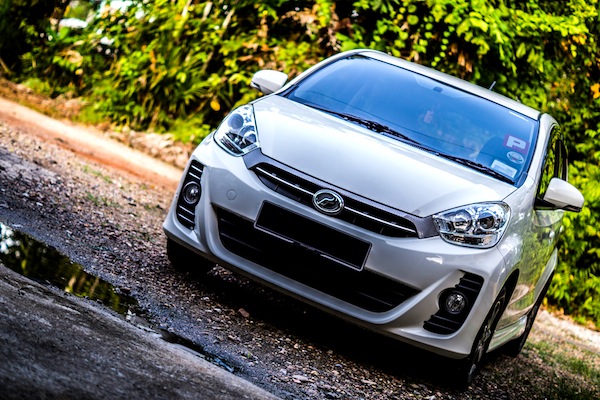
 Perodua Myvi. Picture by Shandys Lee, all rights reserved.
* See the Top 45 All-brands ranking by clicking on the title! *
New car sales in Malaysia are up a very solid 12% year-on-year in April to 58,732 registrations, bringing the year-to-date total to 218,642 units, up 4% on 2013 which was already a record year. After dropping to 27.7% market share in March, local manufacturer Perodua almost passes the 30% share milestone at 29.9% in April thanks to 17,538 sales. It did so in February at 30.8%. Reversely, the 2nd local carmaker, Proton, is down to 17.2% at 10,091 units vs. 19.6% year-to-date, now threatened for 2nd place by Toyota at 15.6% and 9,169 sales. Honda is stronger and stronger at 11.8% vs. 10.3% year-to-date whereas Nissan gets weaker at 5.9% vs. 7.1%. All other manufacturers only hold 2.2% share or less, and among them let’s salute Mazda up 4 spots on March to #7, Peugeot up 3 to #14 and Audi up 8 to #18.
Previous month: Malaysia March 2014: Toyota close to 17% share
One year ago: Malaysia April 2013: Very healthy market up 19% year-on-year
Full April 2014 Top 45 All-brands Ranking Table below.
Malaysia April 2014 – brands:
| Pos | Brand | Apr-14 | % | Mar | 2014 | % | Pos | FY13 |
| 1 | Perodua | 17,538 | 29.9% | 1 | 61,562 | 28.2% | 1 | 1 |
| 2 | Proton | 10,091 | 17.2% | 2 | 42,825 | 19.6% | 2 | 2 |
| 3 | Toyota | 9,169 | 15.6% | 3 | 33,354 | 15.3% | 3 | 3 |
| 4 | Honda | 6,916 | 11.8% | 4 | 22,543 | 10.3% | 4 | 5 |
| 5 | Nissan | 3,493 | 5.9% | 5 | 15,450 | 7.1% | 5 | 4 |
| 6 | Mitsubishi | 1,271 | 2.2% | 6 | 5,018 | 2.3% | 6 | 6 |
| 7 | Mazda | 1,182 | 2.0% | 11 | 3,439 | 1.6% | 10 | 11 |
| 8 | Ford | 1,173 | 2.0% | 7 | 4,097 | 1.9% | 7 | 9 |
| 9 | Volkswagen | 1,056 | 1.8% | 8 | 3,760 | 1.7% | 8 | 10 |
| 10 | Kia | 916 | 1.6% | 9 | 3,308 | 1.5% | 12 | 12 |
| 11 | Isuzu | 887 | 1.5% | 10 | 3,334 | 1.5% | 11 | 8 |
| 12 | Hyundai-Inokom | 825 | 1.4% | 12 | 3,521 | 1.6% | 9 | 7 |
| 13 | BMW | 666 | 1.1% | 13 | 2,401 | 1.1% | 13 | 13 |
| 14 | Peugeot | 610 | 1.0% | 17 | 2,191 | 1.0% | 15 | 15 |
| 15 | Mercedes | 555 | 0.9% | 14 | 2,262 | 1.0% | 14 | 16 |
| 16 | Hino | 455 | 0.8% | 15 | 1,880 | 0.9% | 17 | 14 |
| 17 | Suzuki | 440 | 0.7% | 16 | 1,990 | 0.9% | 16 | 17 |
| 18 | Audi | 241 | 0.4% | 26 | 569 | 0.3% | 21 | 19 |
| 19 | Mitsubishi Fuso | 185 | 0.3% | 19 | 711 | 0.3% | 18 | 20 |
| 20 | Chevrolet | 151 | 0.3% | 18 | 666 | 0.3% | 19 | 21 |
| 21 | Daihatsu | 131 | 0.2% | 23 | 358 | 0.2% | 23 | 23 |
| 22 | Subaru | 113 | 0.2% | 21 | 592 | 0.3% | 20 | 24 |
| 23 | Lexus | 113 | 0.2% | 20 | 562 | 0.3% | 22 | 22 |
| 24 | Volvo | 90 | 0.2% | 24 | 310 | 0.1% | 25 | 26 |
| 25 | Land Rover | 80 | 0.1% | 22 | 326 | 0.1% | 24 | 25 |
| 26 | Scania | 54 | 0.1% | 25 | 238 | 0.1% | 26 | 28 |
| 27 | Mini | 51 | 0.1% | 28 | 183 | 0.1% | 28 | 30 |
| 28 | CAMC | 44 | 0.1% | 29 | 197 | 0.1% | 27 | 31 |
| 29 | Bison | 31 | 0.1% | 33 | 97 | 0.0% | 32 | 38 |
| 30 | Chery | 27 | 0.0% | 31 | 141 | 0.1% | 29 | 27 |
| 31 | JAC | 23 | 0.0% | 30 | 116 | 0.1% | 31 | 37 |
| 32 | Porsche | 23 | 0.0% | 34 | 87 | 0.0% | 33 | 34 |
| 33 | Sinotruk | 20 | 0.0% | 27 | 138 | 0.1% | 30 | 29 |
| 34 | Chana | 20 | 0.0% | 35 | 82 | 0.0% | 34 | 36 |
| 35 | Yutong | 16 | 0.0% | 44 | 34 | 0.0% | 39 | 45 |
| 36 | Auman | 14 | 0.0% | 39 | 41 | 0.0% | 37 | 40 |
| 37 | SsangYong | 13 | 0.0% | 32 | 78 | 0.0% | 35 | 32 |
| 38 | Great Wall | 13 | 0.0% | 36 | 43 | 0.0% | 36 | 33 |
| 39 | Man | 10 | 0.0% | 40 | 35 | 0.0% | 38 | 35 |
| 40 | Renault | 9 | 0.0% | 43 | 16 | 0.0% | 42 | 41 |
| 41 | JBC | 6 | 0.0% | 37 | 27 | 0.0% | 40 | 39 |
| 42 | Bei Ben | 6 | 0.0% | 41 | 22 | 0.0% | 41 | n/a |
| 43 | Renault Trucks | 3 | 0.0% | 38 | 15 | 0.0% | 43 | - |
| 44 | Naza | 1 | 0.0% | 42 | 10 | 0.0% | 44 | 18 |
| 45 | Grand Tiger | 1 | 0.0% | 46 | 6 | 0.0% | 46 | 43 |
Source: MAA, www.motortrader.com.my


